|
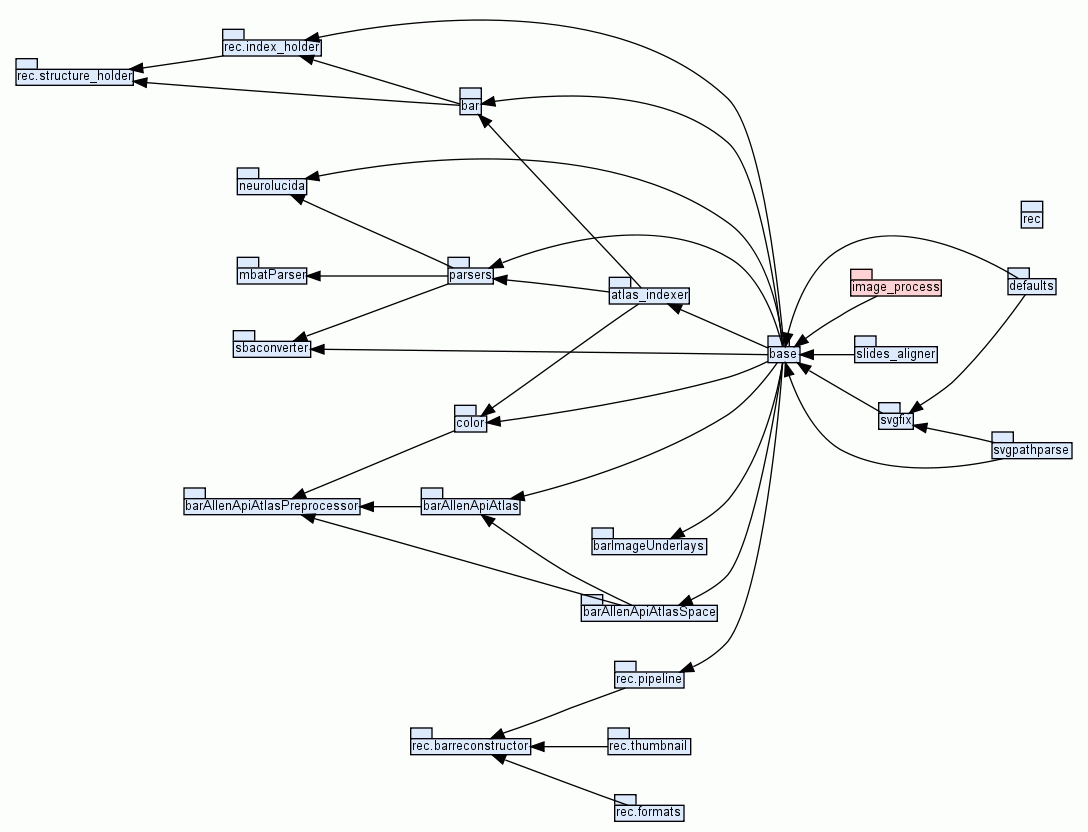
| Import Graph |
| Home | Trees | Indices | Help |
|---|
|
|
The module provides functions to handle basic image processing.

|
| Import Graph |
|
|||
|
|||
|
|||
|
|||
|
|||
|
|||
| str |
|
||
| int |
|
||
| int |
|
||
| bool |
|
||
|
|||
__package__ = |
|||
|
|||
|
|
|
Smooth (and optionally differentiate) data with a Savitzky-Golay filter.
The Savitzky-Golay filter removes high frequency noise from data.
It has the advantage of preserving the original shape and
features of the signal better than other types of filtering
approaches, such as moving averages techhniques.
Parameters
----------
y : array_like, shape (N,)
    the values of the time history of the signal.
window_size : int
    the length of the window. Must be an odd integer number.
order : int
    the order of the polynomial used in the filtering.
    Must be less then `window_size` - 1.
deriv: int
    the order of the derivative to compute (default = 0 means only smoothing)
Returns
-------
ys : ndarray, shape (N)
    the smoothed signal (or it's n-th derivative).
Notes
-----
The Savitzky-Golay is a type of low-pass filter, particularly
suited for smoothing noisy data. The main idea behind this
approach is to make for each point a least-square fit with a
polynomial of high order over a odd-sized window centered at
the point.
Examples
--------
t = np.linspace(-4, 4, 500)
y = np.exp( -t**2 ) + np.random.normal(0, 0.05, t.shape)
ysg = savitzky_golay(y, window_size=31, order=4)
import matplotlib.pyplot as plt
plt.plot(t, y, label='Noisy signal')
plt.plot(t, np.exp(-t**2), 'k', lw=1.5, label='Original signal')
plt.plot(t, ysg, 'r', label='Filtered signal')
plt.legend()
plt.show()
References
----------
.. [1] A. Savitzky, M. J. E. Golay, Smoothing and Differentiation of
   Data by Simplified Least Squares Procedures. Analytical
   Chemistry, 1964, 36 (8), pp 1627-1639.
.. [2] Numerical Recipes 3rd Edition: The Art of Scientific Computing
   W.H. Press, S.A. Teukolsky, W.T. Vetterling, B.P. Flannery
   Cambridge University Press ISBN-13: 9780521880688
|
Perform image tracing via potrace and pipes mechanism. Assumes that image is a grayscale image with only two colours used: black and white. Black colour is considered as foreground while white colour is background colour. The foreground is assumed to be a non-separable area. This function do not perform parsing the output. Tracing Workflow:
|
Custom floodfill algorithm that replaces original PIL ImageDraw.floodfill(). This algorithm appears to be twice as fast as the original algorithm and more roboust. This algorithm requires reimplementing in C/Fortran and connecting to python somehow. Implementation is based on: http://www.academictutorials.com/graphics/graphics-flood-fill.asp This is implementaion on scanline floodfill algorithm using stack. The algorithm is not described here. To get insight please consult google using 'floodfill scanline'.
Note: Please note that this algorithm assume that floodfilled image is in indexed colour mode. |
Select the best level of "gap filling" by analyzing number of flooded pixels for each "gap filling" level. Agorithm used for selecting best level is totally heuristic and relies on assumption that filling each gap is equivalent to rapid lowering of number of flooded pixels (as we have smaller region after closing the gap than before). Algorith tries to seach for such rapid changes and prefers smaller structures rather than larger. If number of flooded pixels do not changes rapidly across different levels of gap filling it means that most probably structure do not have any gaps. In such case, algorithm selects region defined without using "gap filling". There are several cases defined for detecting one, two and more gaps fills. You should note that algorithm do not exhaust every possible case and reconstructed structures should be reviewed manually.
|
Check if elements "are nearly the same" - if they are quotient of consecutive items are less than given treshold: (a2/a1, a3/a2,...) > Treshold.
|
| Home | Trees | Indices | Help |
|---|
| Generated by Epydoc 3.0.1 on Wed Mar 20 14:31:32 2013 | http://epydoc.sourceforge.net |